gnuplot> plot cos(x)gnuplot> plot sin(x)gnuplot> set angles degrees; plot [x=-180:180] [-1:1] sin(x)
gnuplot> plot exp(x**2)gnuplot> plot [x=0:2] [0:20] exp(x**2)
N2O5 → NO2 + NO3
-----------------------
Time(min)   [N2O5] (M)
-----------------------
 0           0.0165
10           0.0124
20           0.0093
30           0.0071
40           0.0053
50           0.0039
60           0.0029
-----------------------
N2O5.txt by cat >> N2O5.txt with your mouse to copy and paste the numbers, and finally supply ^D as EOF to write out the file.Interactive plot for [N2O5] v.s. Time:
gnuplot> set terminal wxt enhanced; set xlabel "Time (min)"; set ylabel "[N_2O_5] (mol{/Symbol \327}L^{-1})"; plot 'N2O5.txt'-
terminal types: x11 or qt (for native X-Windows), windows (for MS-Windows) and wxt (X-tunnel such as "ssh -X" or Xming).
-
{/Symbol \327}stands for the ⋅ (dot) in the PostScript Symbol List
Alternatively, you can create a script file named
N2O5_plot.gplt with the GNUPlot commands above, one per line:
#!/usr/bin/gnuplot --persist
set terminal wxt enhanced
set xlabel "Time (min)"
set ylabel "[N_2O_5] (mol{/Symbol \327}L^{-1})"
plot 'N2O5.txt'  # Note that tilde (~) will NOT ALWAYS work as your or anyone's $HOME inside GNUPlot script!
# end of code
|
then do
chmod +x N2O5_plot.gplt before you run
./N2O5_plot.gplt under shell prompt.Note that for the filename including its path, tilde (
~) will NOT ALWAYS work inside GNUPlot script and therefore, it is necessary to specify the filename in the form of '/home/class/u1234567/folder/N2O5.txt' instead of '~u1234567/folder/N2O5.txt' .In the case to specify the filename under your own $HOME,
'~/folder/N2O5.txt' WILL WORK because tilde ~ is followed immediately by the slash / Save the plot as a graphic file in PNG format interactively:
gnuplot> set terminal png enhanced; set output 'N2O5.png'; set xlabel "Time (min)"; set ylabel "[N_2O_5] (mol{/Symbol \327}L^{-1})"; plot 'N2O5.txt'Then view it under the shell prompt with the Eye of GNOME by
eog N2O5.png & You can also call
eog under gnuplot using shell escape technique with !,gnuplot> !eog N2O5.png &
If you want to use the legacy xv for your own linux system to view the pictures, just fetch it to your USB flash by FileZilla, or type:
scp uXXXXXX@ukko.life.nctu.edu.tw:/usr/local/bin/xv /usr/local/bin/
and enter your password at ukko. Do not forget to change its mode before you can run it:
chmod +x /usr/local/bin/xv
Then view the graphic file under the shell prompt with xv N2O5.png &
Alternatively, to save the plot as a PNG file using a script file named
N2O5_plotpng.gplt :
#!/usr/bin/gnuplot
set terminal png enhanced
set output 'N2O5_plot.png'
set xlabel "Time (min)"
set ylabel "[N_2O_5] (mol{/Symbol \327}L^{-1})"
plot 'N2O5.txt'  # Note that tilde (~) will NOT ALWAYS work as your or anyone's $HOME inside GNUPlot script!
# end of code
|
and
chmod +x N2O5_plotpng.gplt The PNG file
N2O5_plot.png will be generated in the current folder after you run ./N2O5_plotpng.gplt Question 1: How to make plots for ln[N2O5] v.s. Time, and [N2O5]-1 v.s. Time? Create these files N2O5_ln.txt and N2O5_inv.txt by yourself.
Least square fit for the data of ln[N2O5] v.s. Time, in the file "N2O5_ln.txt":
gnuplot> fit m*x+b 'N2O5_ln.txt' using 1:2 via m,band you will be given with fitted slope m and y-intercept b. The fitting output is also saved in fit.log.
If correlation coefficient $\gamma$ is desired, type:
gnuplot> stats 'N2O5_ln.txt'or
gnuplot> stats 'N2O5_ln.txt' name "GAMMA" (save output to variable GAMMA for later use)The output:
 Linear Model:       y = -0.0289 x - 4.097
  Slope:              -0.0289 +- 0.0002205
  Intercept:          -4.097 +- 0.007951
  Correlation:        r = -0.9999
  Sum xy:             -1123
should give consistent results with the
fit command.Plot the fitted line together with data points:
gnuplot> plot [x=0:70] -0.0288989*x-4.09728, 'N2O5_ln.txt'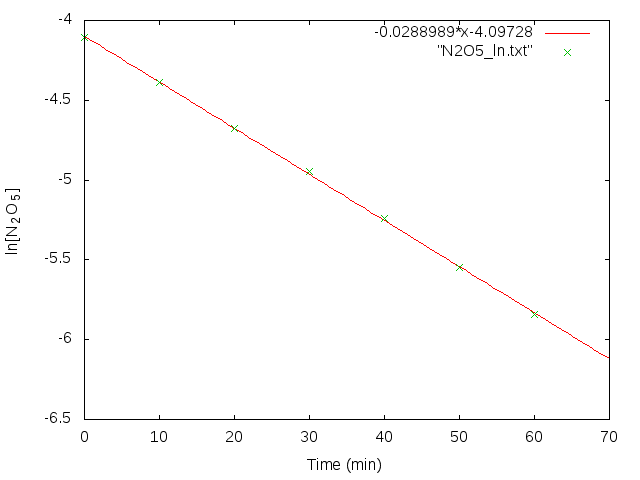
or
gnuplot> set term wxt enh; set label 1 sprintf("{/Symbol g} = %6.4f",GAMMA_correlation) at graph 0.2, graph 0.85; set xlabel "Time (min)"; set ylabel "ln[N_2O_5]"; plot [x=0:70] -0.0288989*x-4.09728, "N2O5_ln.txt" using 1:2 linecolor 7 linewidth 3 pointtype 20 pointsize 1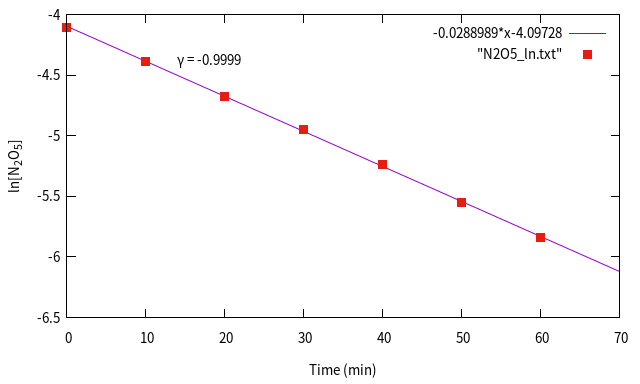
You can type
test to show figures of wxt style and qt style list.Save the graph to a PNG file named
gnuplot> set term png enh; set output 'line_fit.png'; set label 1 sprintf("{/Symbol g} = %6.4f",GAMMA_correlation) at graph 0.2, graph 0.85; set xlabel "Time (min)"; set ylabel "ln[N_2O_5]"; plot [x=0:70] -0.0288989*x-4.09728, "N2O5_ln.txt" linecolor 7 linewidth 3 pointtype 20 pointsize 1Question 2: Since the analysis concludes that the decomposition of N2O5 is a first-order reaction, how to plot its half-life (t1/2)? (link)
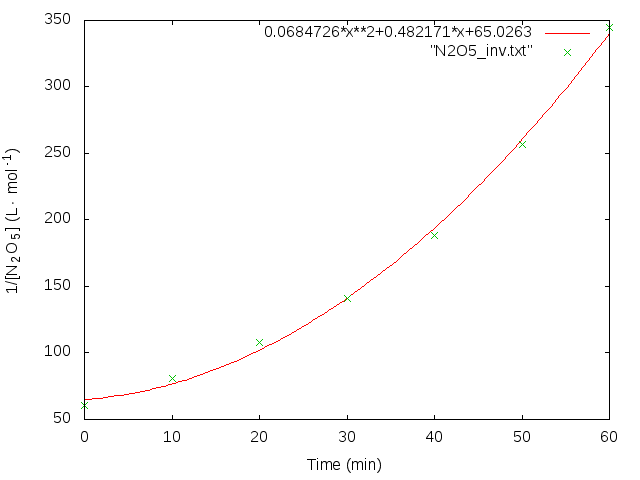
Question 3 is not related to chemical reality: Just in case you want to fit a second-order polynomial for 1/[N2O5] v.s. Time, how can you obtain the following plot?
Question 4: How do you calcuate the activation energy $E_a$ from the experimental data of the following reaction?
$$CH_3 COOCH_2 CH_3 + H_2 O \longrightarrow CH_3 COOH + CH_3 CH_2 OH$$ Hint: From Arrhenius equation,
$$k=Ae^{-\frac{E_a}{RT}}$$ where $A$ is the frequency factor or pre-exponential factor, $T$ is the absolute temperature, $k$ is the kinetic rate constant at temperature $T$, $R$ is the gas constant, and $E_a$ is the activation energy. Taking the natural logorithm, we have
$$ln\ k = ln\ A - \frac{E_a}{RT}$$
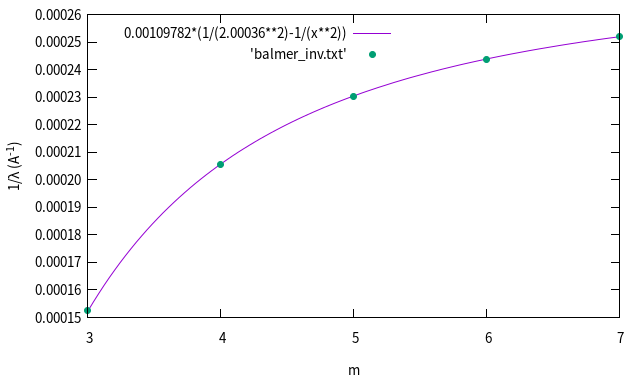
Johann J. Balmer published the line spectra of hydrogen atom in the range of visible light back in 1885. His original paper can be found here. In the table below (captured from p.83 of his paper), the line spectra he reported were:
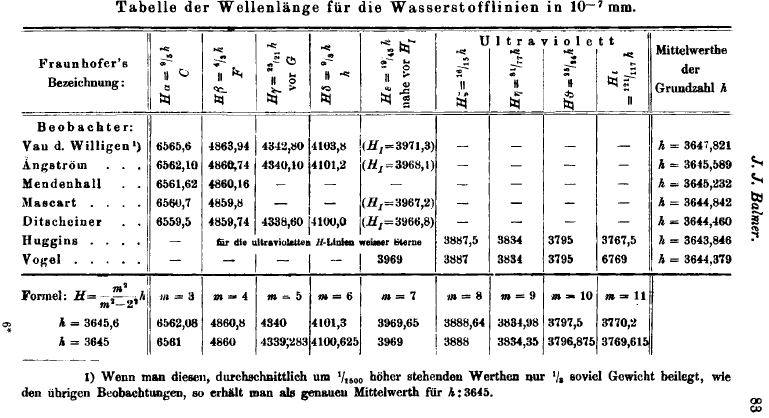
-------------------------------
m     wavelength(Å)  Name
-------------------------------
3     6562.10         Hα
4     4860.74         Hβ
5     4340.10         Hγ
6     4101.2          Hδ
7     3968.1          Hε
-------------------------------
Since you already knew the Rydberg equation:
$$\frac{1}{\lambda}=R_H (\frac{1}{n^2}-\frac{1}{m^2})$$ You may think of curve fitting for the following curve: (how??)
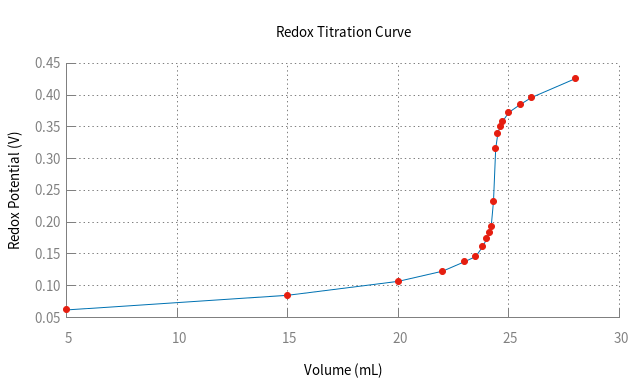
Given the redox titration data below, find the endpoint of titration.
------------------------
Volume   Redox Potential
(mL)        (Volt)
------------------------
  5       0.062
  15      0.085
  20      0.107
  22      0.123
  23      0.138
  23.5    0.146
  23.8    0.161
  24      0.174
  24.1    0.183
  24.2    0.194
  24.3    0.233
  24.4    0.316
  24.5    0.34
  24.6    0.351
  24.7    0.358
  25      0.373
  25.5    0.385
  26      0.396
  28      0.426
------------------------
Plot of Titration Curve
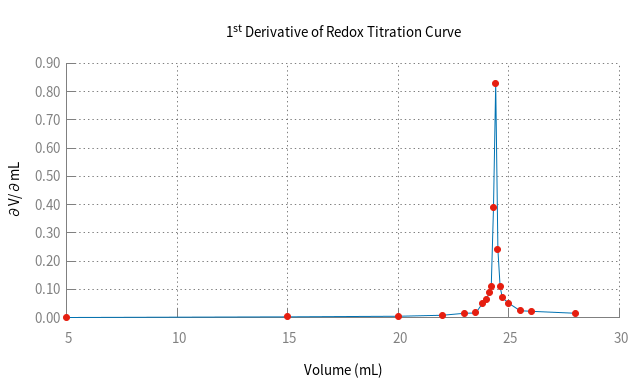
First derivative of the titration curve
Second derivative of the titration curve
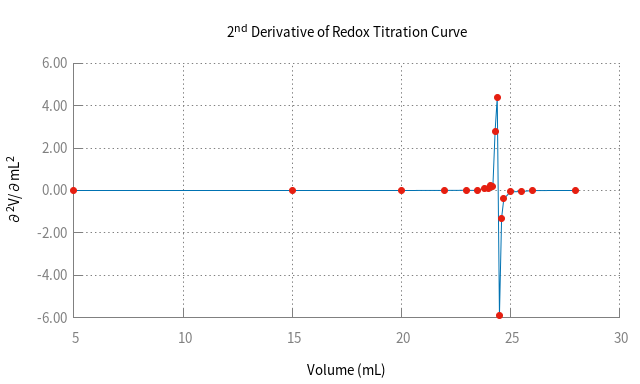
These figures are accomplished by GNUPlot commands such as:
set key off

set border 3

set xtics nomirror

set ytics nomirror

set tics nomirror

set grid linestyle 12

set label at 10,0.1 "1st dir"

set label 2 at 20,0.1 "2nd dir"

set key at 15,0.7 on

set grid back linestyle 0 linecolor rgb '#ff0000'

set format y "%4.3f"

replot
Practice: Draw the titration curve of triprotic acid H3PO4 ;
pH v.s. volume of base added. Its pKa values are:
$pKa_1=7.1\times 10^{-3}, pKa_2=6.3\times 10^{-8}, pKa_1=4.2\times 10^{-13} $
Hint: In case you forgot how to derive [H+], here is the detail procedure. cache PDF